“Sell in May and go away” is a popular market adage. But had you done that this year, you would not have been very happy with your performance. You would have missed out on a bounce back. So focus on time in the market backed by robust data and analysis. Adages are good for prose but if not backed by data, they are only good for small talk and commentary. We are doing some work on the earnings momentum and price momentum. We plan to put it out sometime soon on our site. We will alert you once that is out. Until then happy investing.
- Editor
1. Factor Performance Summary
Growth stocks returned in May along with Momentum and Quality Factors also keeping up. These were also evident in the small cap space. Value takes a breather.
YTD now Growth and Quality are leading the charts. While the spread between EW and Market Weight does suggest some value tilt in the large cap index, smallcaps in a month have overtaken the large cap index and are ahead on a YTD basis. The market equal weight index is out performing the market cap weighted index YTD as well as in May. In fact the monthly spread is at the 80th percentile. This tells us that the market rally is more broad based and even. That looks interesting and something that we will investigate and keep an eye on.
2. Tactical Asset Allocation
No changes in the Market Alpha and Factor Alpha models from last month. So this month we post the Change in Volatility and the Risk On/Risk Off Model. Both models suggest we are in a uptrend. The change in volatility is a very powerful indicator of change in winds and intensity. We will do a write up on it sometime soon.
3. Relative Returns and Risk and Returns- Annual
4. Factor Ranks
Minor shuffles and the action in the YTD and May numbers is not yet evident in the long term factor ranks. If there is a transition back to growth, it will take some time to show up here.
5. Factor Excess Return Correlations
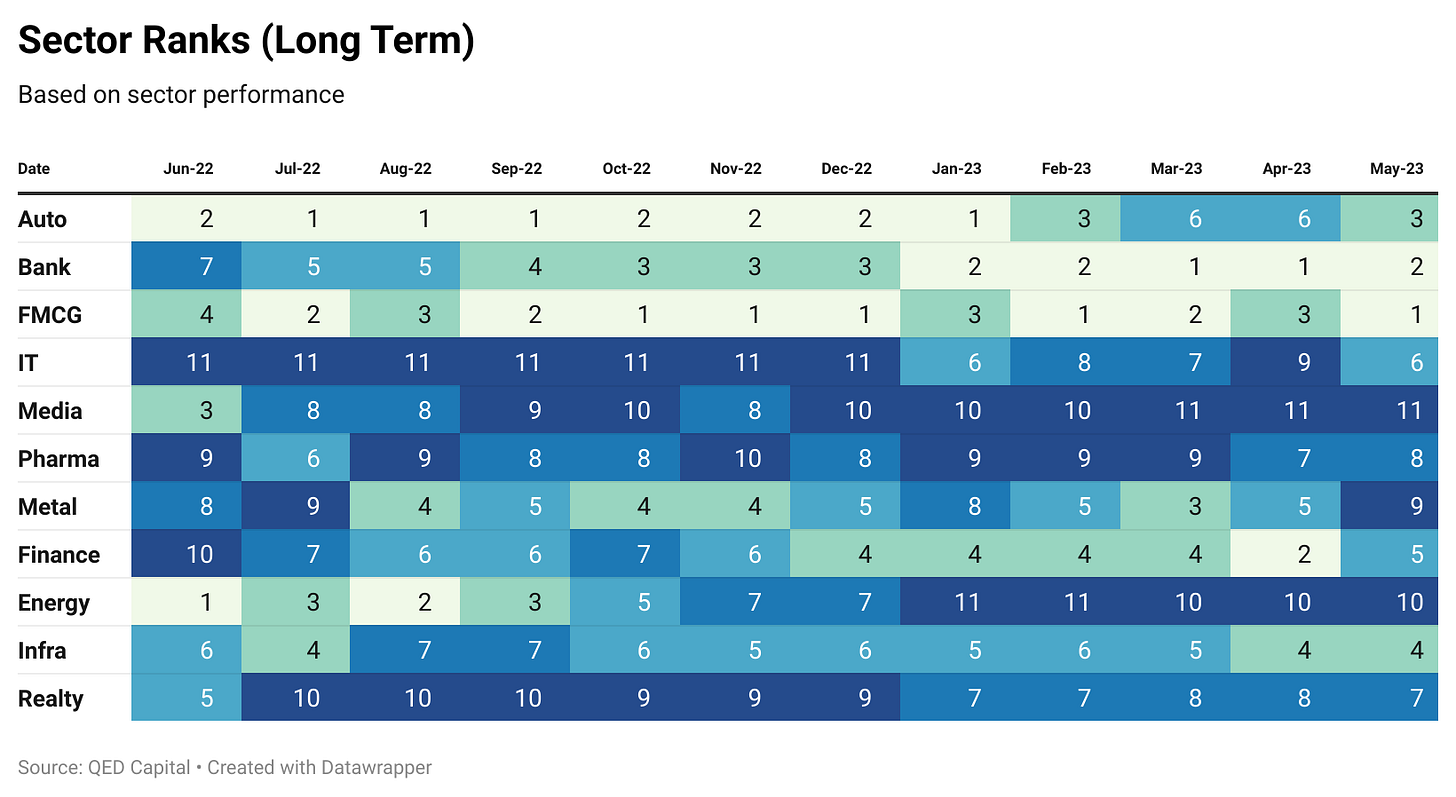
6. Sector Ranks
Autos climb from 6 to 3 and FMCG climbs from 3 to 1. Perhaps lead by Mid Cap IT stocks the IT index also climbs from 9 to 6. Metals and Finance take the biggest hits.
7. Stock Ranks
An important component of our process is ranking stocks on Momentum and Low Volatility over a look back period of 6 months. In the table below we show the top ranked 20 stocks in our Mid and Small Cap universe. The rank is a combined score of Momentum and Low Volatility. It also shows the ranking of the stock one and three months ago.
8. Readings
An Examination of Number of Holdings and Universe Size in Momentum Strategies: Evidence from India by Rajan Raju
Abstract
This paper explores the effects of the number of portfolio holdings and the size of the investment universe on momentum strategies in India. Using mixed linear models, we test hypotheses related to exposure to market, size, and momentum factors, the influence of universe selection on these exposures, and the role of idiosyncratic risk. While concentrated portfolios offer superior factor exposure, they also carry higher idiosyncratic risk. On a risk-adjusted basis, highly concentrated portfolios do not outperform. Our findings also illustrate that the choice of the investment universe and the number of holdings in the portfolio significantly affect performance momentum strategies. We propose a framework targeting craftsmanship alpha, the excess returns skilled managers can achieve beyond quantitative strategies.
Disclaimer: Nothing in this blog should be construed as investment advice. This is purely for educational purposes only. Please consult an investment advisor before investing.


