It has been a very interesting quarter and year till date for factor investing. The big event this year for India i.e. the election outcome is behind us and after a few days of expected volatility the market has resumed its upward trend. The momentum factor true to it adaptable nature has caught up with value and this year is in the same territory as value’s returns. The interaction between equal weight and value and size factors has been fascinating. We show in the form of a scatter plot the relationship between value and equal weight returns. Equal Wt Index’s outperformance has coincided with the outperformance of value from November 2020. With that we are six months into this calendar year and the glass has been quite full. Lets hope it remains that way till the year end.
-Editor
1. Factor Performance Summary
Small caps have performed very well this quarter. Ahead of value, high beta and momentum. Most factors have outperformed the market by a wide margin.
Even YTD, most factors including quality have done better than the market (which is nifty 50 here). We may move to a broader benchmark like Nifty or BSE 500 to get an overall look and rename market as large cap or size from next quarter. Momentum and Value are neck to neck in YTD returns.
2. Tactical Asset Allocation
3. Relative Returns and Risk and Returns- Annual
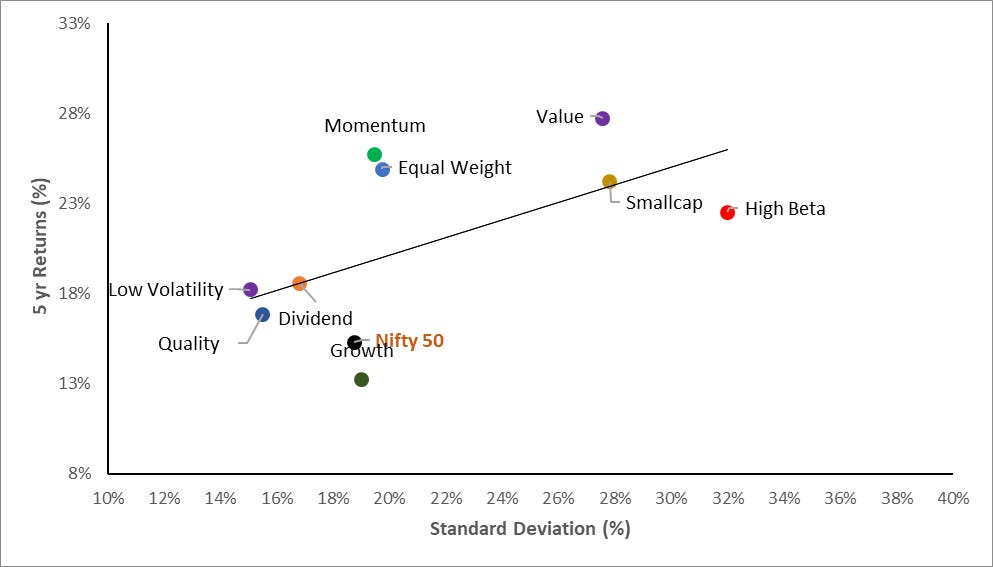
An interesting point in the chart below is the out performance of Nifty Eq Wt (EW) over Mkt Cap Wt (MCW) Nifty 50 over the last 5 yrs. MCW has returned 15% vs 25% CAGR for the EW Nifty index over the last five years at almost same volatility of ~20%.
This usually happens in a scenario when value factor outperforms because EW has some correlation with mean reverting factors like value. You can read more on this here - Not all Index Funds are created Equal.
As the scatter plot below shows the returns and correlation. From Nov 2020 when the value factor started outperforming, EW has outperformed MCW index by 22% .
4. Factor Ranks
Value has been at the top for the last 12 months but Momentum which was at second last place last July is at second spot this Jun. This tells you a lot about this “chameleon” factor. It adapts to the “factor” momentum as well as stock momentum. However, one has to stick with it in good times and bad, to harvest its premium.
5. Factor Excess Return Correlations
The notable point about this table is the increase in correlation between excess returns of Momentum and Value and Momentum and High Beta. This refers to the point of Momentum being a “chameleon” factor. It is a meta-factor.
6. Sector Ranks
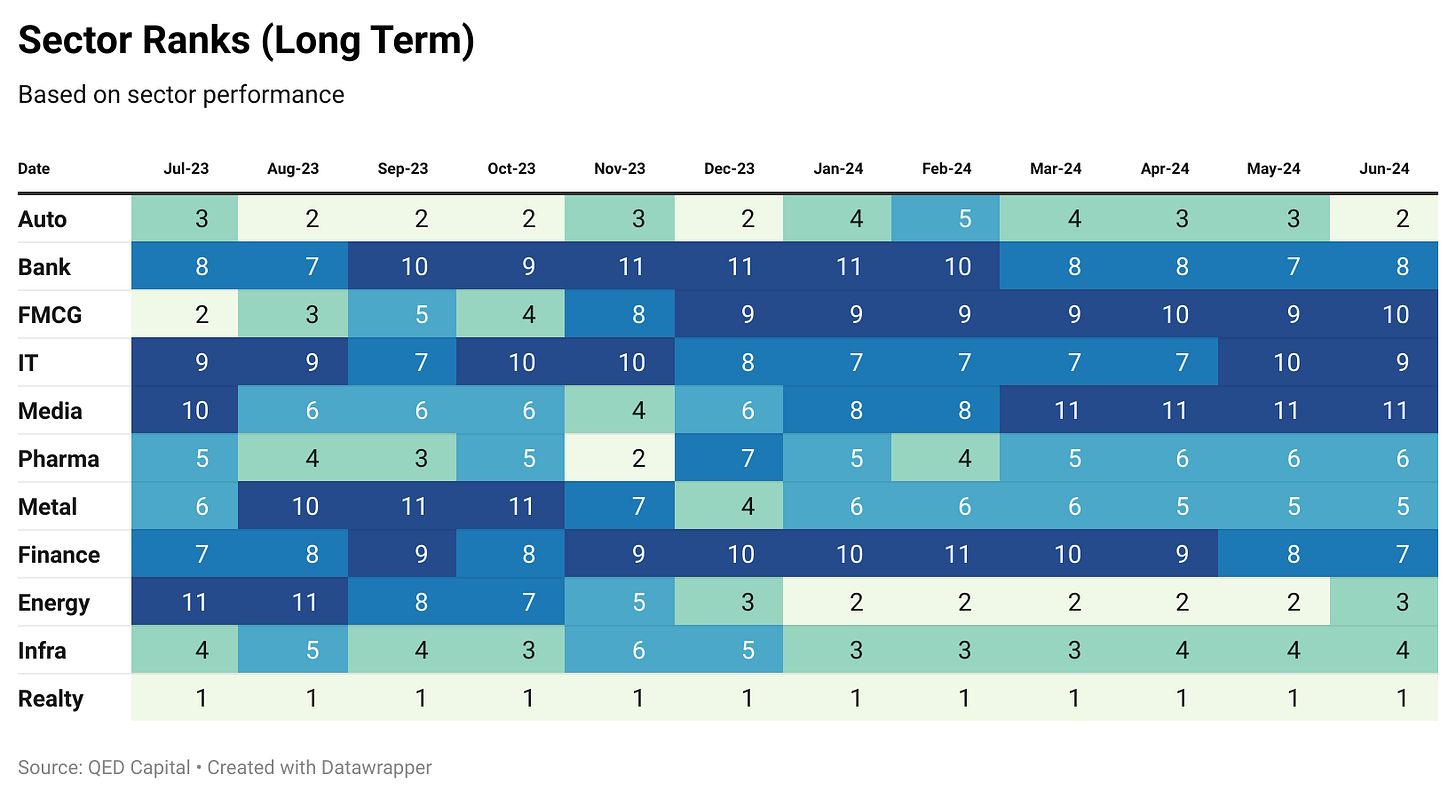
Realty has consistently been at the top rank for the last 12 months, followed by auto and then energy. FMCG has dipped from 2 place last year to the bottom along with media. Banking and Finance continue to remain soft except in pockets like PSU. Pharma and Metal have been in the middle and continue to remain there.
7. Stock Ranks
An important component of our process is ranking stocks on Momentum and Low Volatility over a look back period of 6 months. In the table below we show the top ranked 20 stocks in our Mid and Small Cap universe. The rank is a combined score of Momentum and Low Volatility. It also shows the ranking of the stock one and three months ago.
8. Readings
Don't Judge a Book by its Cover: Evidence of Returns Based Factor Exposures of Multifactor Strategies in India by Rajan Raju and Joshy Jacob.
The number of funds that employ smart beta strategies to generate higher returns for investors has grown in India in recent years. Assessing these funds is challenging due to their diverse factor exposures and relatively short history in the Indian market. This paper uses a contemporary return factor model to analyse a systematically selected sample of funds that follow a multifactor investment approach offered by both traditional asset management companies and fintech platforms. Our results reveal significant variation in the alignment of these funds with multifactor investing principles. Contrary to expectations for disciplined and quantitatively orientated funds, most funds show considerable exposure to idiosyncratic risk rather than systematic factors. These findings suggest that many portfolios are designed to maximise alpha through specific asset exposures rather than factor-based returns. Based on these findings, we identify several policy implications for investors, fund managers, and policymakers. The observed variability in the adherence to multifactor principles underscores the need for transparency in strategy design and execution and the adoption of appropriate benchmarks for performance evaluation.
Disclaimer: Nothing in this blog should be construed as investment advice. This is purely for educational purposes only. Please consult an investment advisor before investing.


